Paper Space Exercise
Introduction
AutoCAD's paper space mode is a bit like having a page in a scrapbook onto which you can paste different views of your AutoCAD drawing. This whole page can then be plotted. This exercise is designed to help you create an A3 drawing sheet in Paper Space and to add floating viewports. The exercise also discusses some other Paper Space considerations such as plotting to scale from Paper Space and layer display in viewports.
Overview of Paper Space
To create the paper space page you must set the tilemode variable to 0, you can do this by double-clicking on "TILE" on the status bar at the bottom of the screen. Once you have done this you will notice that the UCS icon in the bottom left corner of your screen changes to a triangle. This is to let you know that you are now in paper space.
Once you are in paper space you can draw an A3 drawing sheet. You could start out simply by drawing the rectangular outline. Create a new layer called something like "SHEET" and then draw a rectangle 420 x 297 drawing units (this is the correct size of an A3 drawing sheet in millimetres). Centre the rectangle on your screen by using the Zoom Extents command.
You are now in a position to create one or more model space viewports. Using the MVIEW command, from the pull-down menu, simply pick two corners of a rectangle to define your view area. These viewports can be moved, scaled, copied and stretched just like any AutoCAD entity.
Tip: The viewport border is drawn on the current layer. If you do not want the border to plot, you must create a new layer("VIEWPORTS" would be a good name) specially for the viewports which you can turn off prior to plotting.
Create more viewports as required. Once you are happy with the arrangement of viewports (remember you can overlap viewports) you can move to model space by using the MSPACE command, from the pull-down menu.
Once in model space you can work within each viewport as if it were the normal drawing area. You can move from one viewport to another simply by clicking on it. Only one viewport can be active at any one time. The current active viewport is shown with a thick white border. Any changes you make to the drawing in one viewport are simultaneously made in the other viewports.
If you need to make changes to the arrangement of your viewports or to make changes to the drawing sheet you have to move back to paper space using the PSPACE command, from the pull-down menu. Don't forget to move back to model space afterwards.
Creating a Drawing Sheet in Paper Space
Follow the command sequence below to create your own A3 drawing sheet in Paper Space and to add a number of Viewports to show off your drawing to best effect.
Setting up the Drawing Sheet
- Open the 3D Tree drawing you created in the previous exercise or open any other 3D drawing you have to hand.
- Move to paper space by double-clicking
 on the status bar or using the Paper Space command, . Don't worry if the screen goes blank!
 - Create a new layer called "SHEET" and make it current
 .
. - Draw an A3 sheet outline in millimetres (420x297) using the RECTANG command
 . Pick the first point anywhere on screen and define the second point using the relative co-ordinate @420,297.
 - Zoom to drawing extents so that you can see your whole sheet. or Z
 E
E  at the keyboard or
  from the toolbar.
 - Design your own personal title block. Include your name, the drawing name, scale and any other information you consider appropriate. Make sure you create new layers for text, lines etc.
Creating the Viewports
- Create a new layer called "VIEWPORTS".
- Make "VIEWPORTS" the current layer. Create your viewport(s). and then pick the two opposite corners of your new viewport window. You will see your tree appear.
- Arrange your viewports on the sheet. Viewports act just like normal drawing entities so you can move, erase, copy and stretch them.
- Move to model space . Notice that the UCS icon appears in the viewports and that the last viewport you drew is bounded by a thicker line than the others. This viewport is the "active" viewport. To make any viewport the active viewport, just click on it.
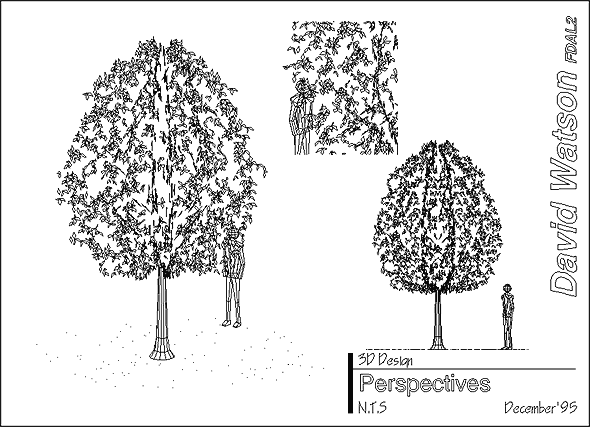
- Once a viewport is active you can change the view in exactly the same way as you can when you are in Tiled Model Space. You can use the ZOOM and DDVPOINT commands to modify the view within each viewport. Change the views in each viewport to show your tree off to its best advantage. See the illustration below.
- Turn the "VIEWPORTS" layer off if you wish to remove the viewport borders and check that the layout looks good. Your drawing is complete and you are ready to plot.
Plotting from Paper Space
There are two things to bear in mind when plotting from Paper Space. First of all, since our drawing sheet has been drawn at full size and in millimetres the plot scale is always 1=1.
Secondly, if you are plotting 3D objects from Paper Space and you want hidden lines removed, don't bother checking that option in the plot dialogue box, it won't work. You have to tell AutoCAD which viewports you want hidden lines removed from before you start plotting. You do this using the Hideplot option of the MVIEW command or by selecting from the pull-down. You are prompted to select viewports so the viewport borders must be visible. If you want hidden lines removed turn Hideplot ON. This may seem a bit of a chore but it does allow you to plot some viewports with hidden lines removed and some without.
Other Paper Space Considerations
Scale
You may be wondering how it is possible to plot drawings at a particular scale in Paper Space if drawings are always plotted using a scale of 1=1. The answer is that the scale of a viewport is determined by its zoom factor. You can use the XP option of the ZOOM command to scale your viewports relative to Paper Space. For example, if you zoom a viewport using 1XP, the scale of the drawing in the viewport would be 1:1 when it was plotted. To calculate the XP factor required simply divide 1 by the scale required. For example to zoom to 1:200 the XP factor would be 1/200=0.005.
The XP zoom factor described above only holds true when the drawing units are millimetres. Most of the time landscape drawings are in metres so we need to add a correction to the calculation to take this into account. Since there are 1000 millimetres in a metre all we have to do is multiply the XP factor by 1000. So, to plot at a scale of 1:200 when the drawing units are metres the XP factor would be 1/200x1000=5.
Layers
It is possible to freeze layers in the current viewport but have them remain visible in all other viewports. Using the DDLMODES command or from the pull-down you can freeze any layer in the current viewport by clicking the ![]() icon in the dialogue box. See the section "Layers in Viewports" in the Object Properties tutorial for more information.
icon in the dialogue box. See the section "Layers in Viewports" in the Object Properties tutorial for more information.
The Finished Drawing
 |
| Example of a sheet layout using paper space viewports. |
There are three viewports in the above example, all showing different views of the same drawing. The middle viewport overlaps the other two and plotting of the viewport borders has been suppressed by turning off the layer on which they were created.
Donate to CADTutor
If you found this tutorial useful, you might like to consider making a donation. All content on this site is provided free of charge and we hope to keep it that way. However, running a site like CADTutor does cost money and you can help to improve the service and to guarantee its future by donating a small amount. We guess that you probably wouldn't miss $5.00 but it would make all the difference to us.
Local Navigation
Sponsored Links
The Basics
- Dual Dimensions in a Dim…
- UCSICON Options
- "Best of" Basics: Irreg…
- Tool Palette Basics
- Original Dimension Value
- Possible Solutions to th…
- Avoid Using 'Standard' i…
- Shorten the Plot Scales…
- Update the Source File B…
- User Increment Angles fo…
- Drawing Information
- 'Sign Language'
- Rotate with the Copy Opt…
- Use the INSERT Osnap on…
- To or From the Current L…


